Venn Diagram- means of grouping data, especially when some data fits into more than 1 group.
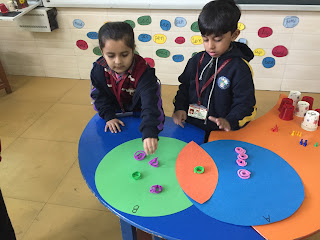
Activity was begin with 2 circles ( A & B) that are not overlapping. Students are required to sort 2 different things in respective circles.
After that, the 2 circles were made overlap so that the orange part in circles becomes common. Things were arranged in circles and common things were being put in the common part( orange).
This was conducted to incorporate the Data Handling & Sorting Things.


No comments:
Post a Comment